Software Polaris

request a copy of full-functioning demo version on CD send email indicating name and address!

About Polaris

Polaris is the software operating with the new modified line of CM-3600 series of instruments from Minolta, especially modified for measuring white samples containing Fluorescent Whitening Agents (FWA). The software takes full advantage of the use of more than one flash-lamp with the CM-3600 instruments to handle fluorescence and absorption separately; the calculation final colorimetric data takes into consideration the mixing of additive and subtractive parts of the detected fluorescent color.
Polaris is a program specifically made for whiteness measurements with following functions:

  • measurement of reflectance spectra of white fluorescent samples
  • calculation of non-fluorescent and fluorescent contributions to reflectance
  • calculation of colorimetric data under consideration of additive and substrative color mixing
  • calculation of whiteness-related values as total numbers and as contributions from base white, shading and fluorescent parts
  • calculation of whiteness-related values under different illuminants to assess metameric effects
  • graphical spectral presentation and printable tables of results
  • storage of results in Access databank

Further features are:
Starting with version 1.3

    • calculation module for scattering and absorption factors
    • tools for selection and recipe formulation for substrates fillers (paper area)

Starting with version 1.4:

    • tools for selection and recipe formulation for substrates and shading agents (all areas)

Starting with version 1.5:

  • tools for selection and recipe formulation for fluorescent whitening agents (all areas)

General features

The instrument provides data in the range of 360 to 740 nm, depending on the model also in two sets as Specular Included (SCI) and Specular Excluded (SCE) conditions.


Model


CM-3600 and CM-3610

CM-3630

Wavelength range

360-740 nm

360-740 nm

Aperture

LAV, MAV, SAV

33 mm diam.

Specular components

SCE / SCI

SCE

Reflectance data is used to calculate main colorimetric data as indicated in the following table:

Illuminants


Observers

Daylight

D50,D55,D65, D75


CIE-1931

Incandescent (2856 °K)

A


CIE-1964

10°

Fluorescent light sources

TL-84, F6 and F11


ASTM-308

2° and 10°

Artificial daylight

C


Colorimetric data


Color difference formulas

Tristimulus values

(X, Y, Z)


Euclidean (L*a*b*)

DELab

Chromaticity coordinates

(x,y)


Euclidean (L*c*h*)

DELch

CIE uniform color coordinates

(L*,a*,b*)


After CIE-94

DE94


After CMC

DECMC


After DIN-99

DEDIN99


After CIE-DE 2000

DECIEDE2000


Whiteness indices


Opacity

After CIE

WICIE, TintCIE


ASTM D-589

C0.89

After Ganz

WIGanz, TintGanz-Griesser


TAPPI T-519/ ISO 2471

On

After Berger

WIBerger


Normalized TAPPI

Cn

After ASTM

WIASTM


Paper brightness


Yellowness index

TAPPI T-525/ ISO 2470

BISO


After ASTM

YIASTM


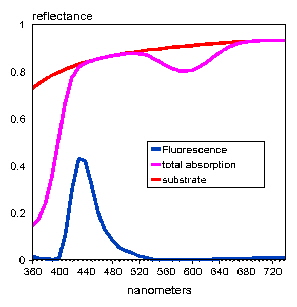
In addition to these quantities several other, area-specific ones are calculated and shown depending on the application. The latter can be chosen among Paper, Recycled paper, Textiles, Detergents, Paints, Liquids and Glass.

 Calculation modes

Main characteristic of Polaris is the separation of absorptive and fluorescent parts of the light coming from the instrument. In the case of fluorescent white samples, fluorescence is separated from absorption and data is calculated according to the formula: 

where

K

= X, Y, Z

Sl

= Illuminant

Rl(a)

= Reflectance (absorptive part)

Rl(f)

= Reflectance (fluorescence part)

kl

= xl, yl, zl tristimulus function

Rl(f) is corrected for distortions from the lamp energy distribution; this correction improves the accuracy of results and leads to an independence of measured values on individual instruments. As a further consequence calculated tint values also agree among the different instruments.

Results are expressed still based on normed whiteness values but the pictorial representation changes (see picture right) is shown as a result of the separation of fluorescent and non-fluorescent parts. Base white can be assessed fully even in those regions until now inaccessible i.e. below 420 or 400 nm. The information gained from this region of the spectrum is vital for assessing the efficiency of the FWA.
Fluorescence separation is set on refelctance data through a calibration using conventional polyester fluorescent standards (from Textilforschungsinstitut Thüringen-Vogtland, Germany ); instruments are delivered precalibrated such that they can be used readily after installation.
The user must decide which whiteness standard to use for daylight conditions among the standard available on the market; other illuminants (C, A and TF-84) are referred to this calibration and do not need additional calibration; the possibility to calculate color data with more than one illuminant allows the assessment of metameric effects of measured whiteness.
Shading agents are taken into account by converting the absorption part into (k/s) values and fitting the background to model substrates to obtain the absorption profile of the dye.
The separation of the three contributions allows the calculation and study of the different phenomena that results into a particular whiteness perception; furthermore this knowledge can be applied for controlling given levels of whiteness or for guiding lab experiments towards conditions needed to achieve them.

System requirements

  • Personal computer Pentium IV or higher with RCS-232 port
  • Operating system Windows NT(SP5)/2000/XP
  • CD ROM reader unit
  • Hard-disk with 20 MB free space (program and working environment)

System components


[Home] [Company Profile] [Industry sectors] [Software] [Reports] [Newsletter] [Contact us] [Customer's Area]

Axiphos GmbH
Arend-Braye Str. 42, D-79540 Loerrach, Germany
Tel:+49 7621 426693 Fax:+49 7621 426698

marketing@axiphos.com

view features as *.PDF files:

English version

Spanish version

German version

view technical basis as *.PDF files:

English version

Spanish version

German version

Navigate through some Polaris windows

Spectral data

Spectral data

Results

Results

L*a*b* diagram

Whiteness diagram

Color differences